


Whether it's internal or public-facing technology, businesses of all sizes depend on the availability of their IT assets, which may include servers, routers, networks, switches, and websites. If you're picking up this book, then you already know the value of monitoring and more than likely have an installation of Zenoss Core running.
Zenoss Core is an open source network and system monitoring platform that is sponsored by Zenoss, Inc. Zenoss, Inc, develops two versions of Zenoss: Core and Enterprise. Core belongs to the community and is supported by the community.
Enterprises adds some value-added features on top of the Core version, such as an extended report library, synthetic web transactions, certified monitors (ZenPacks), and a global dashboard for multiple Zenoss installations. The additional features allow Zenoss Inc., to sell the enterprise version as a commercial software product with support. As open source consumers, we're familiar with this business model. Our focus in the book is on Zenoss Core, but the concepts will also apply to Zenoss Enterprise.
Zenoss Core is a monitoring solution that can be as complex as you need it to be. And while just about anyone can install it, turn it on, and monitor "something," Zenoss Core is packed with features in a complicated interface. The interface has been drastically improved over version 2, but it's not the type of software you can intuitively use—in other words, a bit of guidance is in order.
The role of this book is to serve as your Zenoss Core tour guide and save you hours, days, maybe weeks of time. It's designed to quickly acquaint you with the core features so you can customize Zenoss Core to your needs. It's loaded with screenshots and provides a handy reference guide. Zenoss Core provides a monitoring solution that incorporates the following:
Device management
Availability monitoring
Performance graphs
Event management
User and alert management
Plugin architecture
Monitoring reports
To monitor your IT assets (servers, routers, switches, websites, and anything else attached to your network), you install Zenoss Core to a server. Even though Zenoss Core is intended to be installed on a Linux server, virtual appliances are available that allow Macintosh and Windows users to install a working version of Zenoss Core by using VMware.
After installation, you can manage your Zenoss Core installation and your monitoring setup from a web-based interface. The following screenshot shows a dashboard view:

The web portal is the face of the Zenoss Core system and is the place where we spend most of our time. It provides a single access point to the monitoring system and requires no operating-system-specific knowledge to use. The web interface features drag-and-drop dashboard portlets that display a customized view of the network's health at any given time.
At the heart of the device management capabilities, Zenoss Core uses a configuration management database (CMDB), which stores a model of the IT environment and its change history. Zenoss Core supports adding IT assets (I'll switch out of "executive-speak" and just refer to the "IT assets" as devices from this point on) to the CMDB one at a time or by auto-discovering active devices by walking the routing tables. Devices are then modeled via Simple Network Management Protocol (SNMP), SSH (or Telnet), or port scans.
Zenoss Core allows us to organize devices by user-defined locations, groups, and systems. One of Zenoss Core's most powerful organizational concepts is classes, which allow us to define monitoring characteristics based on a hierarchical classification of devices, which allows a device to inherit the monitoring properties of its parent class.
The following screenshot provides a look at a device status page:

By using ICMP and SNMP monitoring, Zenoss Core reports on the availability of the following:
Network devices
TCP/IP services and ports
URL availability
Windows services and processes
Linux/UNIX processes
Zenoss Core is Level-3 network topology aware, which reduces the amount of alert chatter by creating an event about the problem device only and not about the devices that depend on it.
Performance monitors collect time series data and provide us with a graphical analysis of the following components:
The following screenshot shows a graph based on Zenoss Core's monitoring activity:

Using the built-in event management system, we can configure Zenoss Core to generate an event if a monitored device crosses a defined threshold.
Zenoss Core monitors a variety of sources for signs of trouble, including syslogs, availability and performance monitors, SNMP traps, Windows event logs, and custom scripts. Core features of the event management system include:
Custom events
Automatic event prioritization
Event deduplication
Up/down event correlation
The following screenshot shows the Event Console:
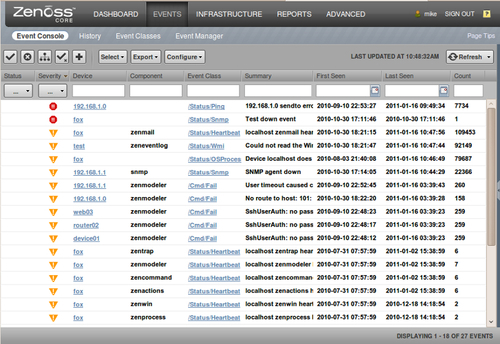
The event system mitigates duplicate events and auto-clears events when the status of the event changes from down to up. Zenoss Core can also collect events from custom scripts and external applications.
In response to events, Zenoss Core can send e-mail or pager alerts, run a script, or do nothing. We configure how Zenoss Core responds to an event by defining alerting rules. Alerting rules are defined on a per user or user-group basis.
Zenoss Core provides several ways for us to extend the base functionality:
We install and configure a Nagios plugin in Chapter 5, Custom Monitoring Templates.
The information presented there will be valuable for those of you who want to develop your own plugins.
The ZenPack architecture allows us to package plugins and configurations for distribution to other users and the community at-large. Chapter 9, Extending Zenoss Core with ZenPacks walks you through the steps of installing a community ZenPack, and how to create your own ZenPack as well.
Zenoss Core packages a set of standard reports that allow us to view what is happening right now, as well as what has happened in the past. The reports integrate with the device management, performance monitors, events, and user functionalities.
The following screenshot shows the All Monitored Components report:
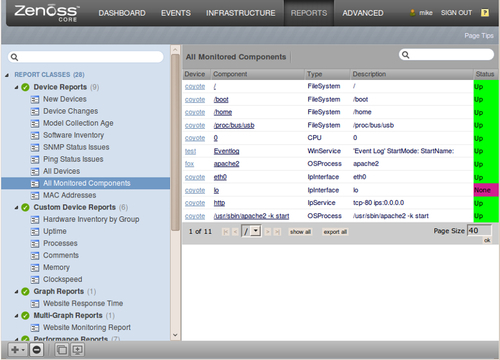
Notice the number of additional reports listed in the sidebar.
The canned reports are nice, but sometimes we need to access and analyze data that the included reports do not cover. Zenoss Core enables users to write custom device reports from the web interface, as seen in the following screenshot:
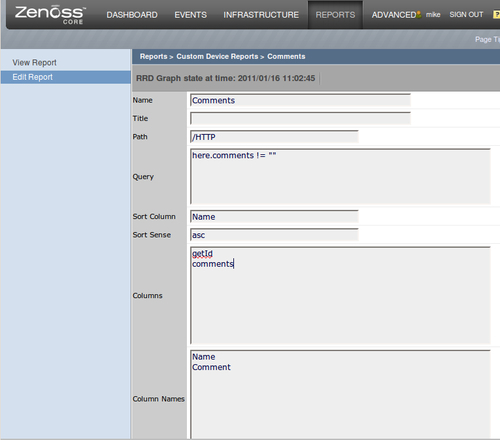
We step through the creation of custom device reports in Chapter 11, Writing Custom Device Reports.
Reviewing the system architecture now provides us with an understanding that can help troubleshoot problems that may arise later. However, reading it to start using Zenoss Core is definitely not required. So feel free to come back later.
Zenoss Core builds upon several open-source software projects to create a robust network and systems management solution. The most notable open-source software components that integrate with Zenoss Core include Zope, Python, MySQL, RRDtool, and Twisted.
When we talk about the system architecture, it helps to conceptually segregate Zenoss Core into three layers:
User
Data
Collection

Zenoss Core is flexible enough to work from a command line, but most of our work will take place via a web interface, which is based on the Zope application server framework.
Zope is a popular, extensible application server written in Python. It features a built-in web server, transactional object database, and HTML templates. Python is the basis for Zope; it's also the basis for Zenoss Core.
Through the web interface, we provide input with both the data and collection layers to accomplish tasks related to the following areas:
Navigation and organization
Device management
Availability and performance monitors
System reports
Event management
Settings and administration
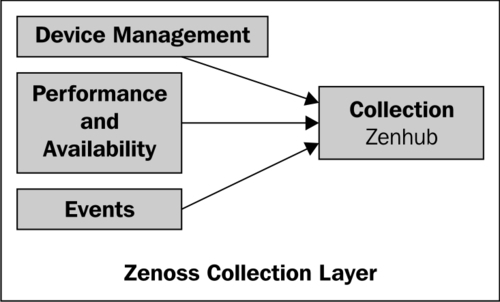
As we might expect, databases are the heart of the data layer, and Zenoss Core stores data in three types of databases. The Collection layer funnels device information to ZenHub, which in turns stores the data in the appropriate place, as seen in the following illustration.

Events are stored in a MySQL database. Zenoss Core generates Events when an established threshold is crossed, such as a server outage or high memory usage. Events trigger actions, such as e-mail or pager alerts.
Time series performance data gets stored in a Round Robin Database (RRD). A RRD differs from a linear database, such as MySQL, in that it's circular—which means the size does not increase over time. Data is stored in a first in, first out basis, which implies that monitoring data is consolidated and eventually lost over time. RRDtool provides Zenoss Core with the ability to log and graph performance data.
The third database deployed by Zenoss is a Configuration Management Database (CMDB). The CMDB is an Information Technology Infrastructure Library (ITIL) standard for managing the configuration, relationship, and change history of the IT environment, which creates a detailed model of the network. Zenoss uses a Zope Object Database (ZODB) to house the CMDB.
The collection layer includes several daemons that gather information about devices, performance, and Events. They feed information to ZenHub to distribute to the appropriate database. The Zenoss Core daemons are easy to identify—they all start with the prefix "zen".
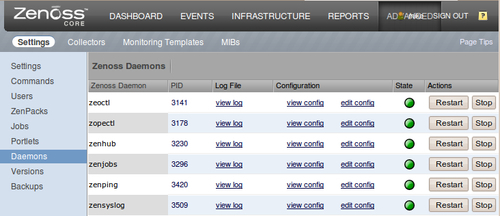
As the following screenshot illustrates, the Daemons page provides us with the complete view of the Zenoss Daemons that includes the process ID (PID) and up/down State. Green is up; red is down. From the interface, we can also view the Log File, edit the Configuration, and start and Stop each daemon.
If we browse the file system, we will find each daemon in $ZENHOME/bin. $ZENHOME is an environment variable, which allows us to talk about the Zenoss installation directory without knowing exactly where it is. For example, I may install to /usr/local/zenoss/zenoss while you install to /home/zenoss.
Twisted is an integral network communication protocol for the daemons. The Twisted Core README file describes Twisted as an "event-based framework for Internet applications"
Finding the devices on our networks is a prerequisite to managing them, and Zenoss Core not only finds the devices, it models them. Device modeling builds a detailed overview of the network by recording the following types of information: system dependencies, available services, and change history.
The following table describes the daemons responsible for discovering and modeling devices:
|
Device daemon |
Description |
|---|---|
|
Queries the devices via SSH/Telnet, SNMP, and port scans when we model the device. Each time | |
|
Runs each time a request is made to discover a network or device. |
Zenoss uses SNMP as a primary collection protocol. However, it can also collect information via ICMP pings, port scans, and plugins.
The Zenoss Core performance and availability daemons help us determine if the devices on our network are available and performing within our established guidelines. If our monitored systems perform in an unexpected way, Zenoss Core generates an event.
The following daemons play an important role in collecting performance and availability data:
|
Performance daemon |
Description |
|---|---|
|
|
Stores the collected performance data in RRD files so that RRDtool can graph device performance over hourly, daily, weekly, monthly, or yearly durations. |
|
|
Provides a way to run custom scripts and third party plugins including Nagios and Cacti plugins from within Zenoss. |
|
|
Monitors the processes on Linux, Unix, and Windows systems. |
|
|
Pings a device and reports an up or down status to determine if a device is active or not. |
|
|
Tests the TCP ports and reports an up or down service. |
When a device goes down or a service crosses a predetermined threshold, such as available disk space, Zenoss Core generates an event. Events can generate a notification alert or run a custom command (to automatically take remedial action to fix the event, for example).
Not only can Zenoss Core generate its own events, but it can collect events from external sources (for example, custom system administration scripts) and convert the information to a "Zenoss-style" event.
The following table outlines the Zenoss Core event daemons:
In this chapter we provided a brief overview of Zenoss Core's monitoring capabilities and the underlying technology that makes it all work. It's our blueprint for what we'll discuss as we devote the rest of the book to configuring our monitoring environment. As we work through the rest of the book, we'll demonstrate the core concepts that will help you adapt Zenoss Core to your specific environment.
Feel free to treat each chapter as a stand-alone topic and skip around as needed. In Chapter 2, Discovering Devices we jump right in and discover devices.
